Solar forecasts & calibration
SolDial's solar forecasts are tuned to your system, not a generic regional average.
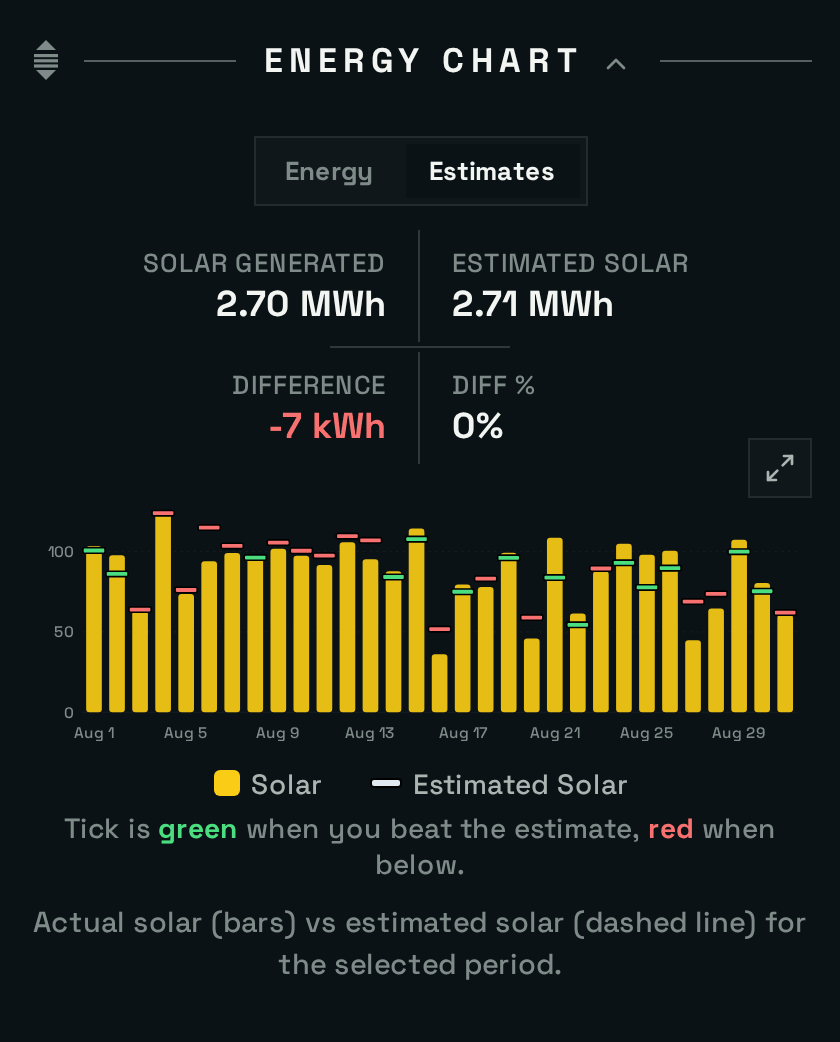
A month of daily production against SolDial's estimate, on the Energy Chart's Estimates tab.
How the forecast is built
The short version — each step links to a full explanation below.
- Physical model — production is modeled with NREL's PVWatts using your exact coordinates and your per-array setup from Settings → Solar Profile.
- Weather adjustment — today and the coming week are modeled hour by hour from five weather models’ forecasts, and each past day is rebuilt hour by hour from the weather actually recorded that day.
- One-time calibration to your data — after your first full year of history, SolDial locks in a calibration factor so the model tracks how your specific roof actually performs.
1. The physical model (NREL PVWatts)
The base is PVWatts, the national lab's solar calculator. SolDial runs it for your exact coordinates from Tesla (not your town or zip), using what you entered in Settings → Solar Profile — capacity, tilt, azimuth, mount type, module type, and losses, per array, nothing assumed. Each array is modeled separately and summed, so an east/west split or a differently-pitched second string is represented as itself.
The output is a full 8,760-hour model year for your roof. One thing that surprises people who plot it: the model year is not a smooth ideal curve. PVWatts runs on a “typical meteorological year” — real hour-by-hour weather stitched together from representative historical months at your location — so it has cloudy days, storms, and clear stretches baked in, on dates that have nothing to do with this year's weather. So SolDial never estimates from a single model date. Days the Estimates chart shows ahead of today, and the forecast whenever live weather can’t be reached, start from the typical day for that date: the model averaged over the 15 days around it, which keeps the season (sun angle, day length) and drops the model year's own clouds. Today, the coming week and past days don't use the model year at all; they're modeled from their own weather, below.
2. Weather adjustment
Today and the coming week run the same hour-by-hour model described next for past days, on the forecast instead of the record: the hourly outlook of five independent weather models (NOAA’s GFS, with the high-resolution HRRR over the U.S., plus ECMWF, Canada’s GEM, Germany’s ICON and the UK Met Office), averaged. Each model is wrong on different days; their average is wrong least often. So a clear morning before a cloudy afternoon shows up in the morning, where it happens, instead of as one middling number spread across the day, and the pace card’s “expected by now” follows it. The forecast refreshes at least every 15 minutes while it can still change, and the dashboard, widgets, Alexa and automations all read the same one.
Past days in the Estimates chart are rebuilt hour by hour from the weather actually recorded at your location that day (Open-Meteo's historical weather). For every hour SolDial works out where the sun was, how much light arrived, how much of it came straight from the sun versus scattered across the sky, and how that lands on each of your roof faces at its own tilt and direction. It also accounts for how hot the panels ran, snow sitting on them after a storm, and what your inverters can pass. So a cloudy Tuesday is measured against what your roof could make on that cloudy Tuesday, and a north-facing section gets credit for the sky light it actually catches on a gray day. The weather record reads a little bright on partly cloudy days, so those days are trimmed slightly, by a correction measured across many systems.
Two things the physics can't know about your home are learned from your own history: how low the sun can get before trees, neighbors or hills block it, and an overall scale for your system. For past days both come from the same year your calibration locks on (next section); until it locks, the model runs as-is with a 10° horizon. In the Estimates chart, days ahead of today, and any day the historical record hasn't filled in yet, use the typical day.
The forecast also tunes itself to your system every week. It looks back five weeks and compares what your system actually made with what the model makes of the forecasts that were issued for those same days, then sets its scale from that, leaving out days with an outage, snow on the panels or missing data. So it reflects how your roof performs against forecast weather right now, and a new system gets it after about two weeks of history instead of waiting a year for calibration. Where SolDial has recorded your production hour by hour on enough clear days, the forecast also learns how high the sun has to climb to clear obstructions in the eastern sky and in the western sky separately, which is what shapes the morning and evening of the curve. Until then the curve’s shape uses the single horizon, capped at 10°, because a horizon learned from daily totals can’t tell trees to the east from trees to the west.
What the weather data can't see still shows up on single days: a storm cell parked over your street, heavy haze, snow that stays on the panels through a long freeze. Those read as one-off misses; a gap that holds in one direction for weeks is the one worth a closer look.
3. One-time calibration to your data
A generic model can't know your real shading, your string layout, or how your panels actually behave. So SolDial measures it. Once your site has a full year of history with at least 200 producing days, it compares your total actual production against what the model expected across all of those days, and locks that ratio in as your system's calibration factor. Over a full year the weather cuts both ways and cancels out, so what's left in the factor is the persistent signature of your real roof. If your Tesla history already covers a year when you connect, this happens right away; newer systems calibrate the day they cross the year mark. Either way, the app shows a one-time note when your calibration locks. Non-producing days (outages, data gaps) are skipped, and the factor is clamped to a sane range so a bad data patch can't distort it.
Calibration happens exactly once, and that's deliberate. If the factor were refreshed every year, it would quietly absorb any efficiency loss — the expected curve would forever chase your actuals downward, and the drift would be invisible. Locked once, it's a fixed yardstick from your first year: the gap that slowly opens between actual and expected as a system ages is real aging, not a moving target. The past-day model's two learned settings come from that same year (the 365 days before the lock), so they stay fixed too. The one exception: editing your array setup in Settings resets the factor, since the old one no longer describes the new system — a fresh calibration then locks by the same rules, and the past-day model relearns with it.
Degradation signal
Because the yardstick never moves, real efficiency loss becomes visible — but know what you're looking at. The weather adjustment takes out most of the day-to-day swing, not all of it: snow, haze, and passing storms can still move a week or a month by several percent, while true panel degradation is only about half a percent per year. It shows up across years, not weeks. The cleanest habit: compare your best clear days each summer against the same days in prior summers, or compare full-year totals — both strip the weather out of the question.
Check the math yourself
Settings → Account → Export my data includes three Expected Solar tabs: all 8,760 hours of the model year, a daily rollup (the raw model day, the calibrated day, and the 15-day typical day used for days that haven't happened yet), and a method sheet listing your inputs, the exact calibration number, and the past-day model's learned scale and sun height. The only thing not in the file is the hour-by-hour weather itself, since that comes from live and historical weather data.
Forecast pace
On the dashboard, "today's pace" shows how much production is expected by now versus expected for the full day, so you can tell at a glance if you're ahead or behind.